Jump to HeaderJump to Main ContentJump to Footer
Michigan State University
Digital Experience Studio

University Communications and Marketing

Digital Experience Studio

  • Experience Program
    • Website Project Process
    • Working with a Vendor
    • Glossary
    • Taxonomy Data Dictionary
  • |
  • Experience Design
    • Website Strategy
    • Website Structure
    • Information Architecture and Navigation
    • User-Centered Design Conventions
    • Common UX Issues
    • Enterprise Design System
    • Content Planning
    • Creating Accessible Content
    • Taxonomy and Filters
  • |
  • Website Technology
    • Web Standards
    • Search Engine Optimization
    • Cascade CMS
    • Sitecore CMS
    • Content Hub Overview
    • Content Hub DAM
    • Content Hub Operations

    SitecoreAI

    Sitecore user login
  • |
  • Social Media
    • Alt Text Bookmarklet
    • Meta Ad Pixel
    • Social Media and Web Integration
    • Sprinklr

    Sprinklr

    Sprinklr user login
  • |
  • Analytics
    • Google Analytics (GA4)
    • Testing
    • Data Visualization

    Google Analytics

    Google Analytics user login
  • |
  • News and Events
    • News and Updates
    • Events and Trainings
Digital Experience Studio

University Communications and Marketing

  • Experience Program
  • Experience Design
  • Website Technology
  • Social Media
  • Analytics
  • News and Events

< Experience Program

  • Website Project Process
  • Working with a Vendor
  • Glossary
  • Taxonomy Data Dictionary

< Experience Design

  • Website Strategy
  • Website Structure
  • Information Architecture and Navigation
  • User-Centered Design Conventions
  • Common UX Issues
  • Enterprise Design System
  • Content Planning
  • Creating Accessible Content
  • Taxonomy and Filters

< Website Technology

  • Web Standards
  • Search Engine Optimization
  • Cascade CMS
  • Sitecore CMS
  • Content Hub Overview
  • Content Hub DAM
  • Content Hub Operations

SitecoreAI

Sitecore user login

< Social Media

  • Alt Text Bookmarklet
  • Meta Ad Pixel
  • Social Media and Web Integration
  • Sprinklr

Sprinklr

Sprinklr user login

< Analytics

  • Google Analytics (GA4)
  • Testing
  • Data Visualization

Google Analytics

Google Analytics user login

< News and Events

  • News and Updates
  • Events and Trainings
Digital Experience Studio > Social Media > Sprinklr > Analytics and Research >

Post Performance Baselines

Michigan State University

MSU Tools and Resources

  • A to Z Index
  • Find People
  • Email
  • Tech Support
  • Social Media Directory

Communications Resources

  • University Communications and Marketing
  • University Trademarks and Licensing
  • MSU Brand Studio
  • MSU Editorial Style Guide
  • MSU Photos

Contact us

517-355-7505

Address

Michigan State University 408 West Circle Drive East Lansing, MI 48824

Follow Us

  • Visit our Facebook page
  • Visit our page on X
  • Visit our Instagram page
  • Visit our LinkedIn page
  • Visit our YouTube page
  • Visit our TikTok page

If you're having accessibility issues, please let us know.

Know MoreTransparency Reporting: Budget & Salary/Compensation
Michigan State University
  • Contact Information|
  • Site Map|
  • Privacy Statement|
  • Site Accessibility|
  • Call MSU: (517) 355-1855|
  • Visit: msu.edu|
  • Notice of Nondiscrimination|

SPARTANS WILL|© Michigan State University|

Post Performance Baselines

Why Use Post Performance Baselines?

When evaluating post performance, it is often most helpful to compare analytics between posts on a unit’s account. Different units have different audiences and different accounts have different follower counts.

Evaluating a post’s success compared to other posts to the same audience on the same account can lead to better insights than comparing how one unit’s account or post performs compared to another unit’s account or post.

University Communications and Marketing has long used baseline measures to evaluate how individual posts are performing and to guide unit budgets when paying to boost posts so the department is only boosting posts that perform well organically. The University Communications and Marketing analytics group has built this capability into Sprinklr so that other units may also evaluate their own post performance baselines.

Post Performance Baseline Dashboards

The Post Performance Baseline Dashboard can be cloned to use as a template for a unit’s custom dashboard. The purpose of this dashboard is to evaluate the performance of individual social media posts by drawing comparisons to 12-month rolling average baselines.

Performance is measured in this dashboard using two metrics: 

  • Engagements: The total amount of interactions on a post, including the sum of reactions, comments and shares. This measures how effective the content is at enticing reactions.
  • Reach: The potential number of individuals exposed to a post. This measures total awareness of the post.

Engagements and reach of posts are compared to baselines. A baseline is defined as the average performance of internal comparable content for a given metric. Baselines are meant to provide a point of reference for how content typically performs.

Baselines are calculated using data from all primary update posts (excluding retweets, replies, comments, etc.) published from an account. Each network account has its own baseline. If custom fields are applied as metatag data, baselines can also be calculated for groups of similar content.

This dashboard provides two baselines for each network: 

  • Engagement baseline: Average engagements in the past 365 days
  • Reach baseline: Average reach in the past 365 days 
Training Video: Baseline Performance Reporting
Video Thumbnail
Create a Unit Baseline Dashboard

Work With Good Data

A Note for Custom Field Users

Reporting dashboards will only be as accurate as the data put into the system. If using custom fields as a filter on a dashboard, users need to ensure all unit posts have been properly tagged. Follow the instructions in this video to use the Editorial Calendar to confirm that any natively posted content has been tagged after being auto-imported into Sprinklr. 

Video Thumbnail

Documentation updated: Nov. 1, 2024

Clone the Template

A template of the dashboard, titled “Social Baselines Template Report,” has been placed in the “Template Reports - Clone for Use” folder in the Reporting section of Sprinklr. Each unit can clone this dashboard and apply appropriate filters to pull in data from its account.

For direction on where to find the template and how to clone it, see Reporting Dashboards.

Note: Be sure to give the cloned version of the dashboard a new name and save in the appropriate folder so it is clear which unit is the owner.

Find the Dashboard

After cloning the dashboard, locate the cloned copy:

  1. Click on “Modern Engagement.”
  2. Select “Reporting” under “Analytics.”
  3. Select the down arrow next to “Reporting Home” in the top left corner of the page.
  4. Select “My Dashboards” from the drop-down menu.
  5. The dashboard will be listed here with the name selected during the cloning process. Or, search for the dashboard copy by typing the selected name in the search box.
  6. Update the filters and settings for the unit. See “Use the Unit Baseline Dashboard,” below.
Use the Unit Baseline Dashboard

Confirm Settings

Before using the dashboard, confirm that the proper filters are set for the account and desired time span.

Note: Do not edit any filters on the original dashboard template. Users must clone the template, save the copy as their own dashboard and then adjust the filter for the unit account group.
  1. At the top of the dashboard, be sure the Date Range filter is set to the desired time span to calculate the baseline. Use “Last 365 Days” for annual baseline calculations. 

    Note: It is a best practice to choose longer-duration date ranges for baselines. This avoids having the baseline become a moving target and helps to maintain consistency when comparing different months. University Communications and Marketing recommends a 13-month rolling baseline, or longer. A minimum of six months should be used.
  2. Set Message Type to “Update.” This limits content across networks to only include original posts published to an account feed. This excludes replies, comments, retweets, shares, sent direct messages, etc. These would skew data results if they were included.
     
  3. Select the account group specific to the unit. See Account Groups for a list of account group codes. 

    Note: Baselines are calculated for only one account. When selecting an account group, select a Tier 2 account group (Tier 3, when applicable). Users need to avoid having multiple accounts of the same channel (e.g., two Facebook pages) in the dashboard.
  4. Ensure “Is Post Part of Multi Photo” is set to “False.” For all Facebook posts that include multiple photos, each individual photo will also appear in the data as its own post. For example, a post with four photos will create five posts total in the system — the original post and one for each individual photo. These additional posts typically receive lower engagement than the original news feed post, which significantly decreases the Facebook baseline. Selecting “False” will filter all extra photo posts from the data on this dashboard, leaving only the original news feed post.
     
  5. Confirm Section Filters is enabled.
     
  6. Confirm the Social Network filter matches the section tab in view.
     
  7. Add any custom field filters, if needed, at the dashboard level. Do not add additional filters at the section level. Click “Add Filter” to add a filter at the dashboard level. Type the Custom Field name in the top search box (A) or scroll to find the custom field (B). Check the box next to the single parameter to be included for the specific custom field.

Using Custom Fields as Filters

  • Custom fields are metatags used to group content with similar goals, objectives, themes, campaigns, traits or target audiences.
  • Custom fields can be added as a filter on the dashboard, allowing users to calculate baselines specific to one group of content.
  • Use custom fields that start with the 3-4 letter acronym for the unit accounts. Other custom fields will not apply to content posted to unit accounts and will not result in properly filtered data on the dashboard.
  • Different groups of content may perform better on average than others, so drawing comparisons within a custom field can allow for a fairer evaluation of performance for that type of content.
  • See Message Metadata for more information on uses for custom fields.
Example Use Case: Units may wish to filter an Instagram baseline dashboard by Post Type to evaluate the performance of grid posts versus video. To do this, select “Update” under the filter Message Type and check results. Then change “Update” to “Video.”
Navigate the Unit Baseline Dashboard

To change the social network (i.e., channel), click on the associated section heading.

The dashboard sections each contain several widgets.

Baselines

This widget displays averages for engagements and reach, as well as the number of posts these averages are based on. This widget is meant to show the average performance of content across the account that individual posts are measured against to determine their relative success.

The example below shows the baseline for all posts on Instagram over the past 365 days.

Screenshot showing baseline calculations for number of posts, engagements and reach for a social media account.

Most Recent Posts

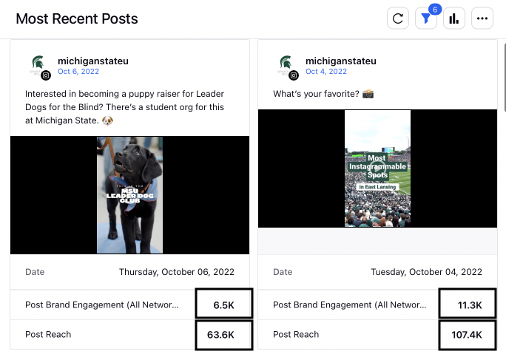
This widget displays the latest content that was published on the account, filtered according to filters set for the dashboard. Engagement and reach totals from this widget can be compared to the averages in the Baseline widget.

Screenshot of two social media posts with the post brand engagement and post reach numbers highlighted.

In this example, the baselines were:

  • Engagement: 6,423.3
  • Reach: 62,104.6

This would mean:

  • The post on the left performed slightly above baseline for both engagement and reach.
  • The post on the right performed well above baseline for engagement and reach.

Top Engaging Posts

This widget displays the posts within the date range and account filter with the highest number of engagements. This is meant to give a quick glimpse at the highest-performing content in the time period. When the dashboard time filter is set to “Last 365 Days,” it will show top-performing content for the past year.